The University of Queensland

Centre for Coal Seam Gas Centre for Coal Seam Gas

Assess and manage rapid change
  • Home
  • Our services / Contact us

Tool #5 Identifying 'Hotspots'

Home › Tool #5 Identifying 'Hotspots'
Indicators
Data
Profile
Interactions
Hotspots
Scenarios
Archetypes
Levers

Tips for using this tool

There are no tips for this page.

External Tools

There are no external resources for this page.

Resources

You need to login or register to access these resources.

Related tools:

There are no related tools for this page.

On a resource development roller coaster?  Rapid growth followed by a seemingly sudden downturn?  You are not alone! There are lessons to be learned from communities who have been through this process before.

What do we mean by hot-spots?

A ‘hot spot’ is an area of social and economic impact that needs attention.  Hot spots can be found where there is a sudden or significant change in an indicator.  They can also be seen where connections in a systems diagram show compounding effects.  For example, a downturn in housing costs can signal that a resource boom has ended.  This can lead to a decrease in population and an increase in crime rates. 

Communities facing rapid resource development often display similar hot spots.  This is the case particularly where growth and change occurs at a rate faster than local government and other institutions can respond.

There are lessons to be learned from communities who have been through a period of rapid growth.  At left are studies of four communities that have experienced rapid growth.  Further examples are being compiled for logged in users of this site.  

Examples of hot spots are below (for logged in users).  

Last updated 16 February 2018
Last reviewed 12 November 2015

Please login below or register your interest here.

Enter your e-mail address.
Enter the password that accompanies your e-mail.
CAPTCHA
This question is for testing whether or not you are a human visitor and to prevent automated spam submissions.
End of tool
Next: Tool #6 Exploring possibilities

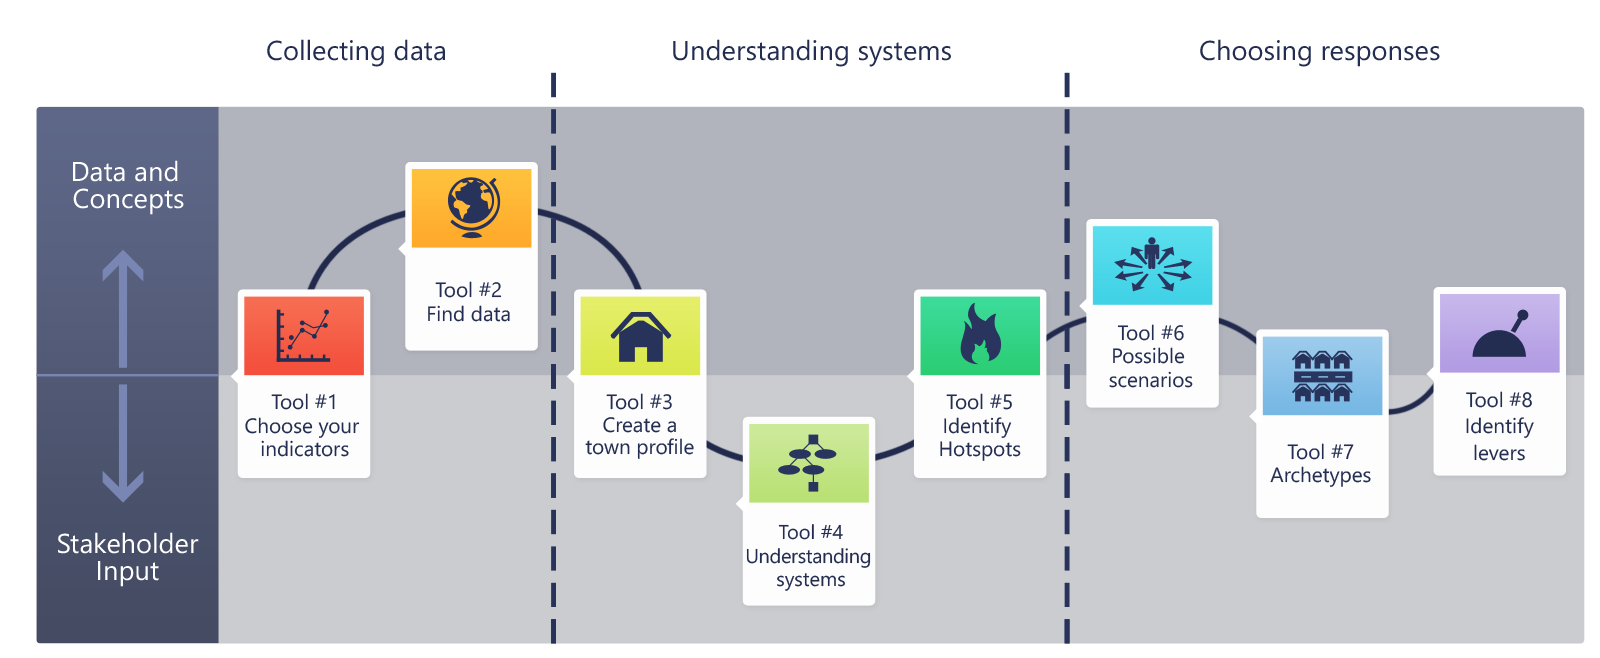
Flowchart

Flowchart
Tool #1 Tool #2 Tool #3 Tool #4 Tool #5 Tool #6 Tool #7 Tool #8
Home › Tool #5 Identifying 'Hotspots'

The University of Queensland, Australia


© 2015 The University of Queensland

Explore

  • Register

Help

  • Contact

Centre for Coal Seam Gas 
The University of Queensland
Sir James Foots Building, level 8
St Lucia QLD 4072, Australia

Office hours
8:30 am - 4:30 pm, Monday to Friday

General enquiries
Email: ccsg@uq.edu.au
Phone: +61 7 3346 4101