- Do you need to demonstrate that a problem exists?
- Do you need to show that an investment or intervention has made a difference?
- Do you want evidence for decision making? This tool helps you choose appropriate indicators.
What is an indicator?
What is your town’s population? How much does it cost to rent a 3-bedroom house? An indicator can be anything for which change over time can be measured. Indicators 'point to' an issue or condition. They are useful for complex issues where there is no single, or direct measure of change. Indicators should be meaningful and relevant. While there are many possible indicators, the aim is for a small number of indicators (we call these primary, or baseline indicators) that together, characterise a community or region.
Indicators allow you to understand what is happening now. They can tell you how things have been in the past. Trends can suggest where you might be heading. For example, are housing prices shooting up, or have they been climbing steadily for years, or both?
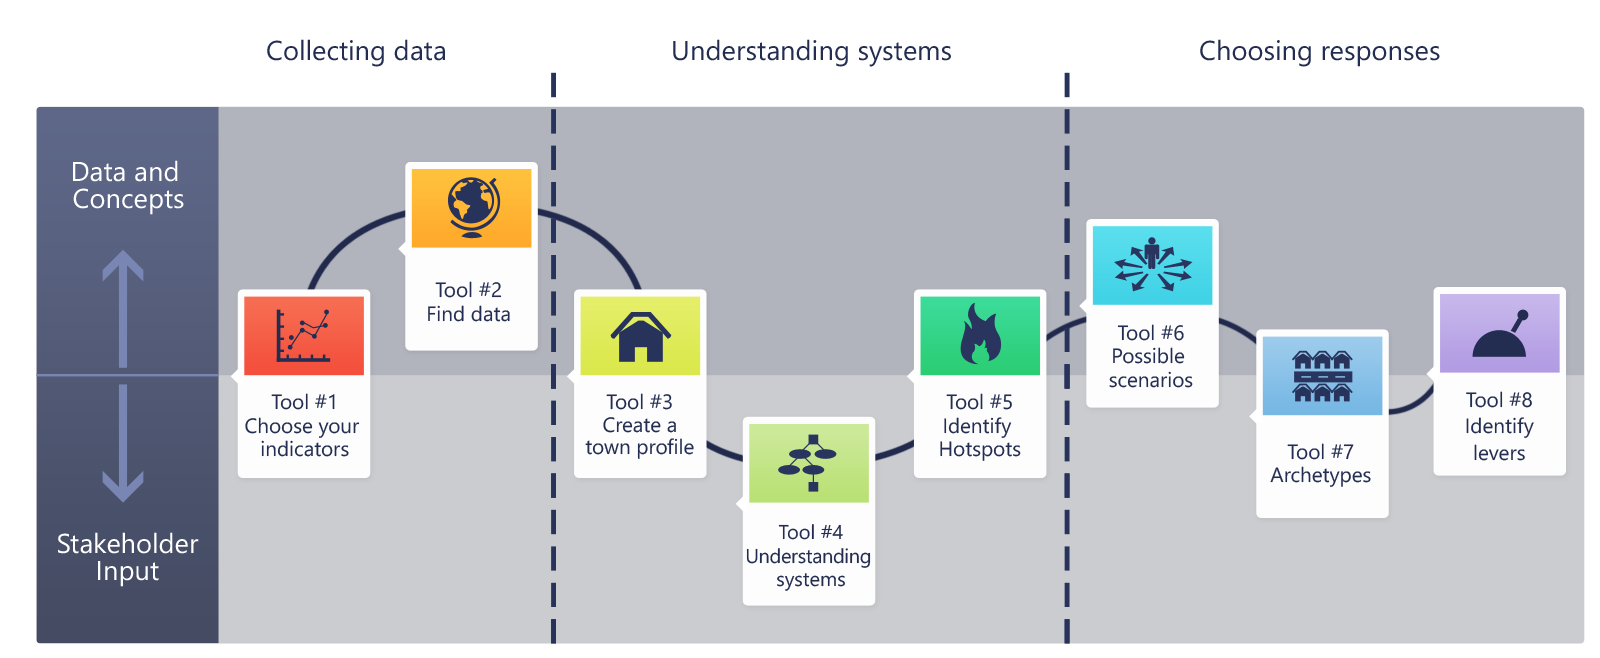
A good indicator (or set of indicators) can warn of problems that need attention. Because there are so many factors that can be tracked, indicators are generally grouped into categories or themes. This tool kit currently has five working themes. We will be inlcuding more.
Indicators can also have different ways of measuring them. For example, housing costs can be can be measured using the average price for a 2-, 3- or 4- bedroom house. Or, it could be the average weekly rent? You also need to decide whether to include sale or rental prices for apartments. So, even once you have selected a factor to track, there are choices that need to be made.
This tool is a library of measures that can be used as indicators. Each is explained. Knowing what to measure and why is an important first step.
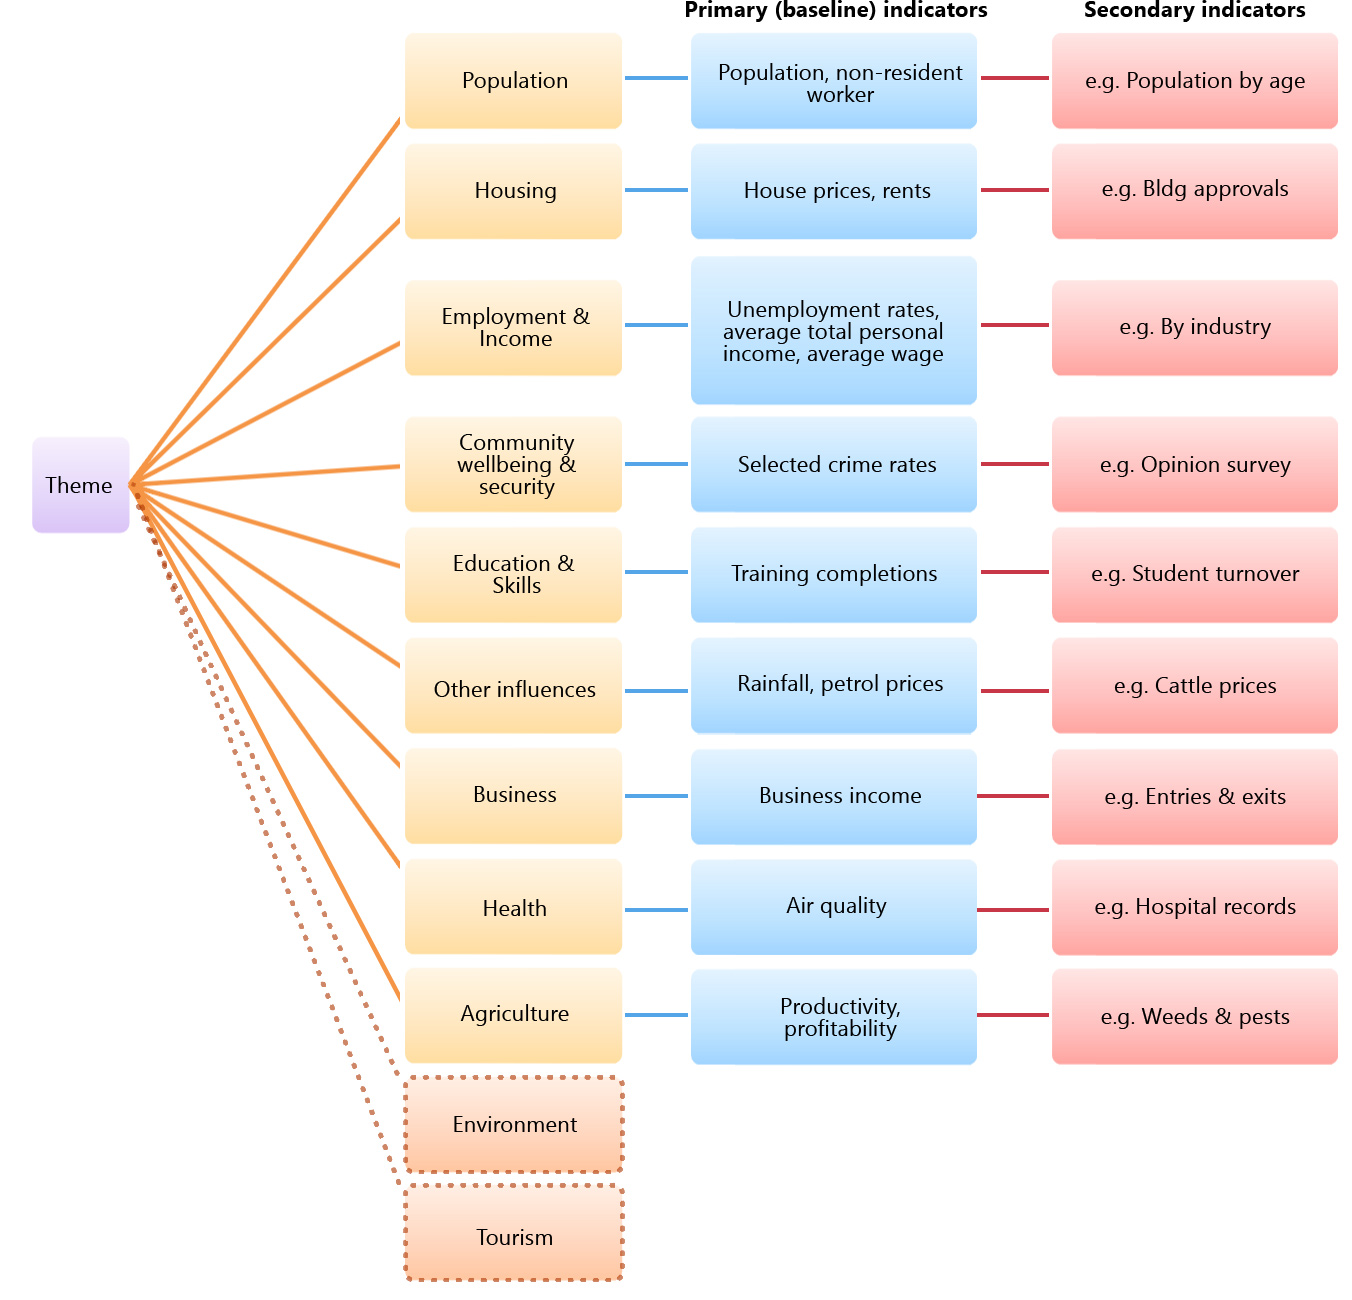 Population Housing Employment and income Community wellbeing and security Education and skills Other influences Primary indicator data: Population Primary indicator data: Housing Primary indicator data: Employment and income Primary indicator data: Community wellbeing and security Primary indicator data: Education and skills Primary indicator data: Other influences
 How do I choose which indicators to use?
We selected indicators based on key issues identified in government reports and resource company social impact management plans (e.g., housing). We then showed a long list of indicators to people in the community, industry, and government. They identified their priorities, e.g., overall population rather than the population of young families. That helped to narrow a list of 20 indicators to fewer than 10. It is important to keep the list short. You need to keep on board people who are not fond of data and charts.
Effective indicators are:
- Relevant - they tell you about something you need to know;
- Easy to understand - by everyone, not just ‘experts’;
- Reliable - the information/data is from a trustworthy source
- Based on accessible data - the information is freely available, and at regular enough time intervals to inform decision making.
How do I use this tool?
Step 1: Select an indicator theme from the diagram.
Step 2: Follow the links to find out what each indicator can tell you about.
Please login below or register your interest here.